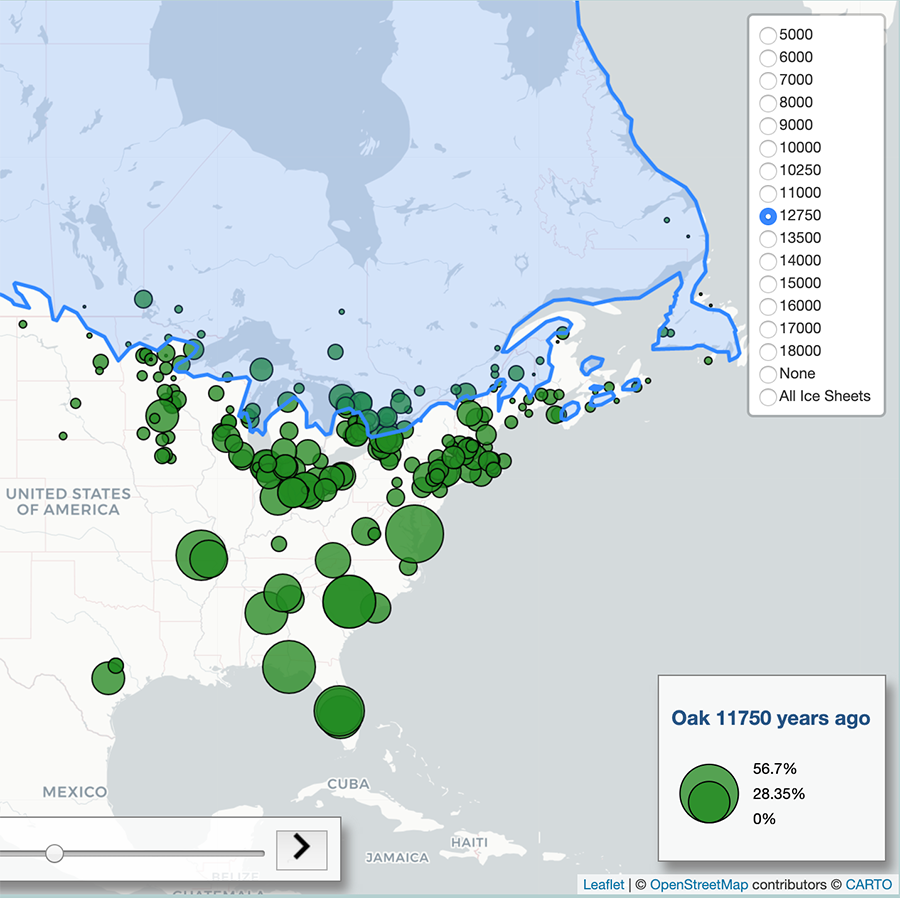
Ice Age Tree Explorer
An online interactive map developed with Leaflet for exploring data on North America's paleoecological history. It expresses the data in two ways: a heat map of all pollen data and proportional symbols showing pollen data at individual sites. You can sequence through time, overlay ice sheets, and retrieve information on science and context.

When Congress Fails the Environment
An infographic about Congressional voting records, fossil fuel political donations, and US residents' attitudes towards the environment, made using IndieMapper and Adobe Illustrator.
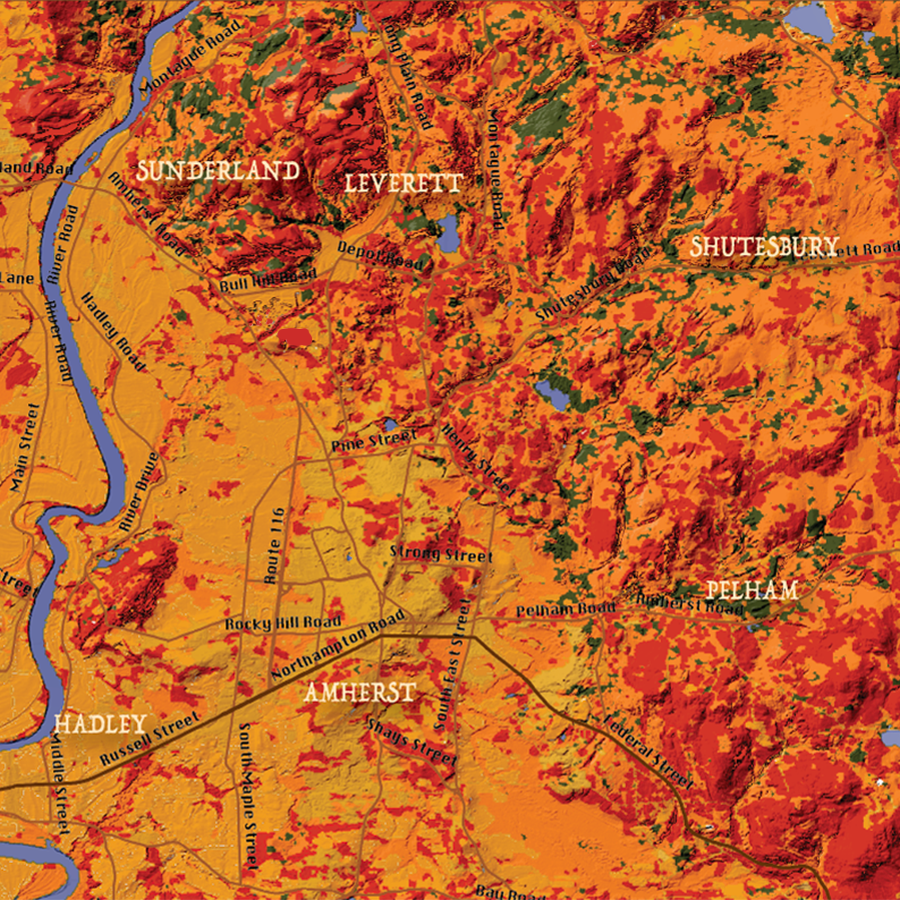
Three Perfect Days in the Happy Valley
A tourist map showing the fall landscape and attractions of the Pioneer Valley in western Massachusetts, made using ArcGIS, Adobe Photoshop, and Adobe Illustrator.
Stylized O'Keeffe Interactive Map
A slippy map styled on Georgia O'Keeffe's landscape paintings, created using Mapbox Studio.
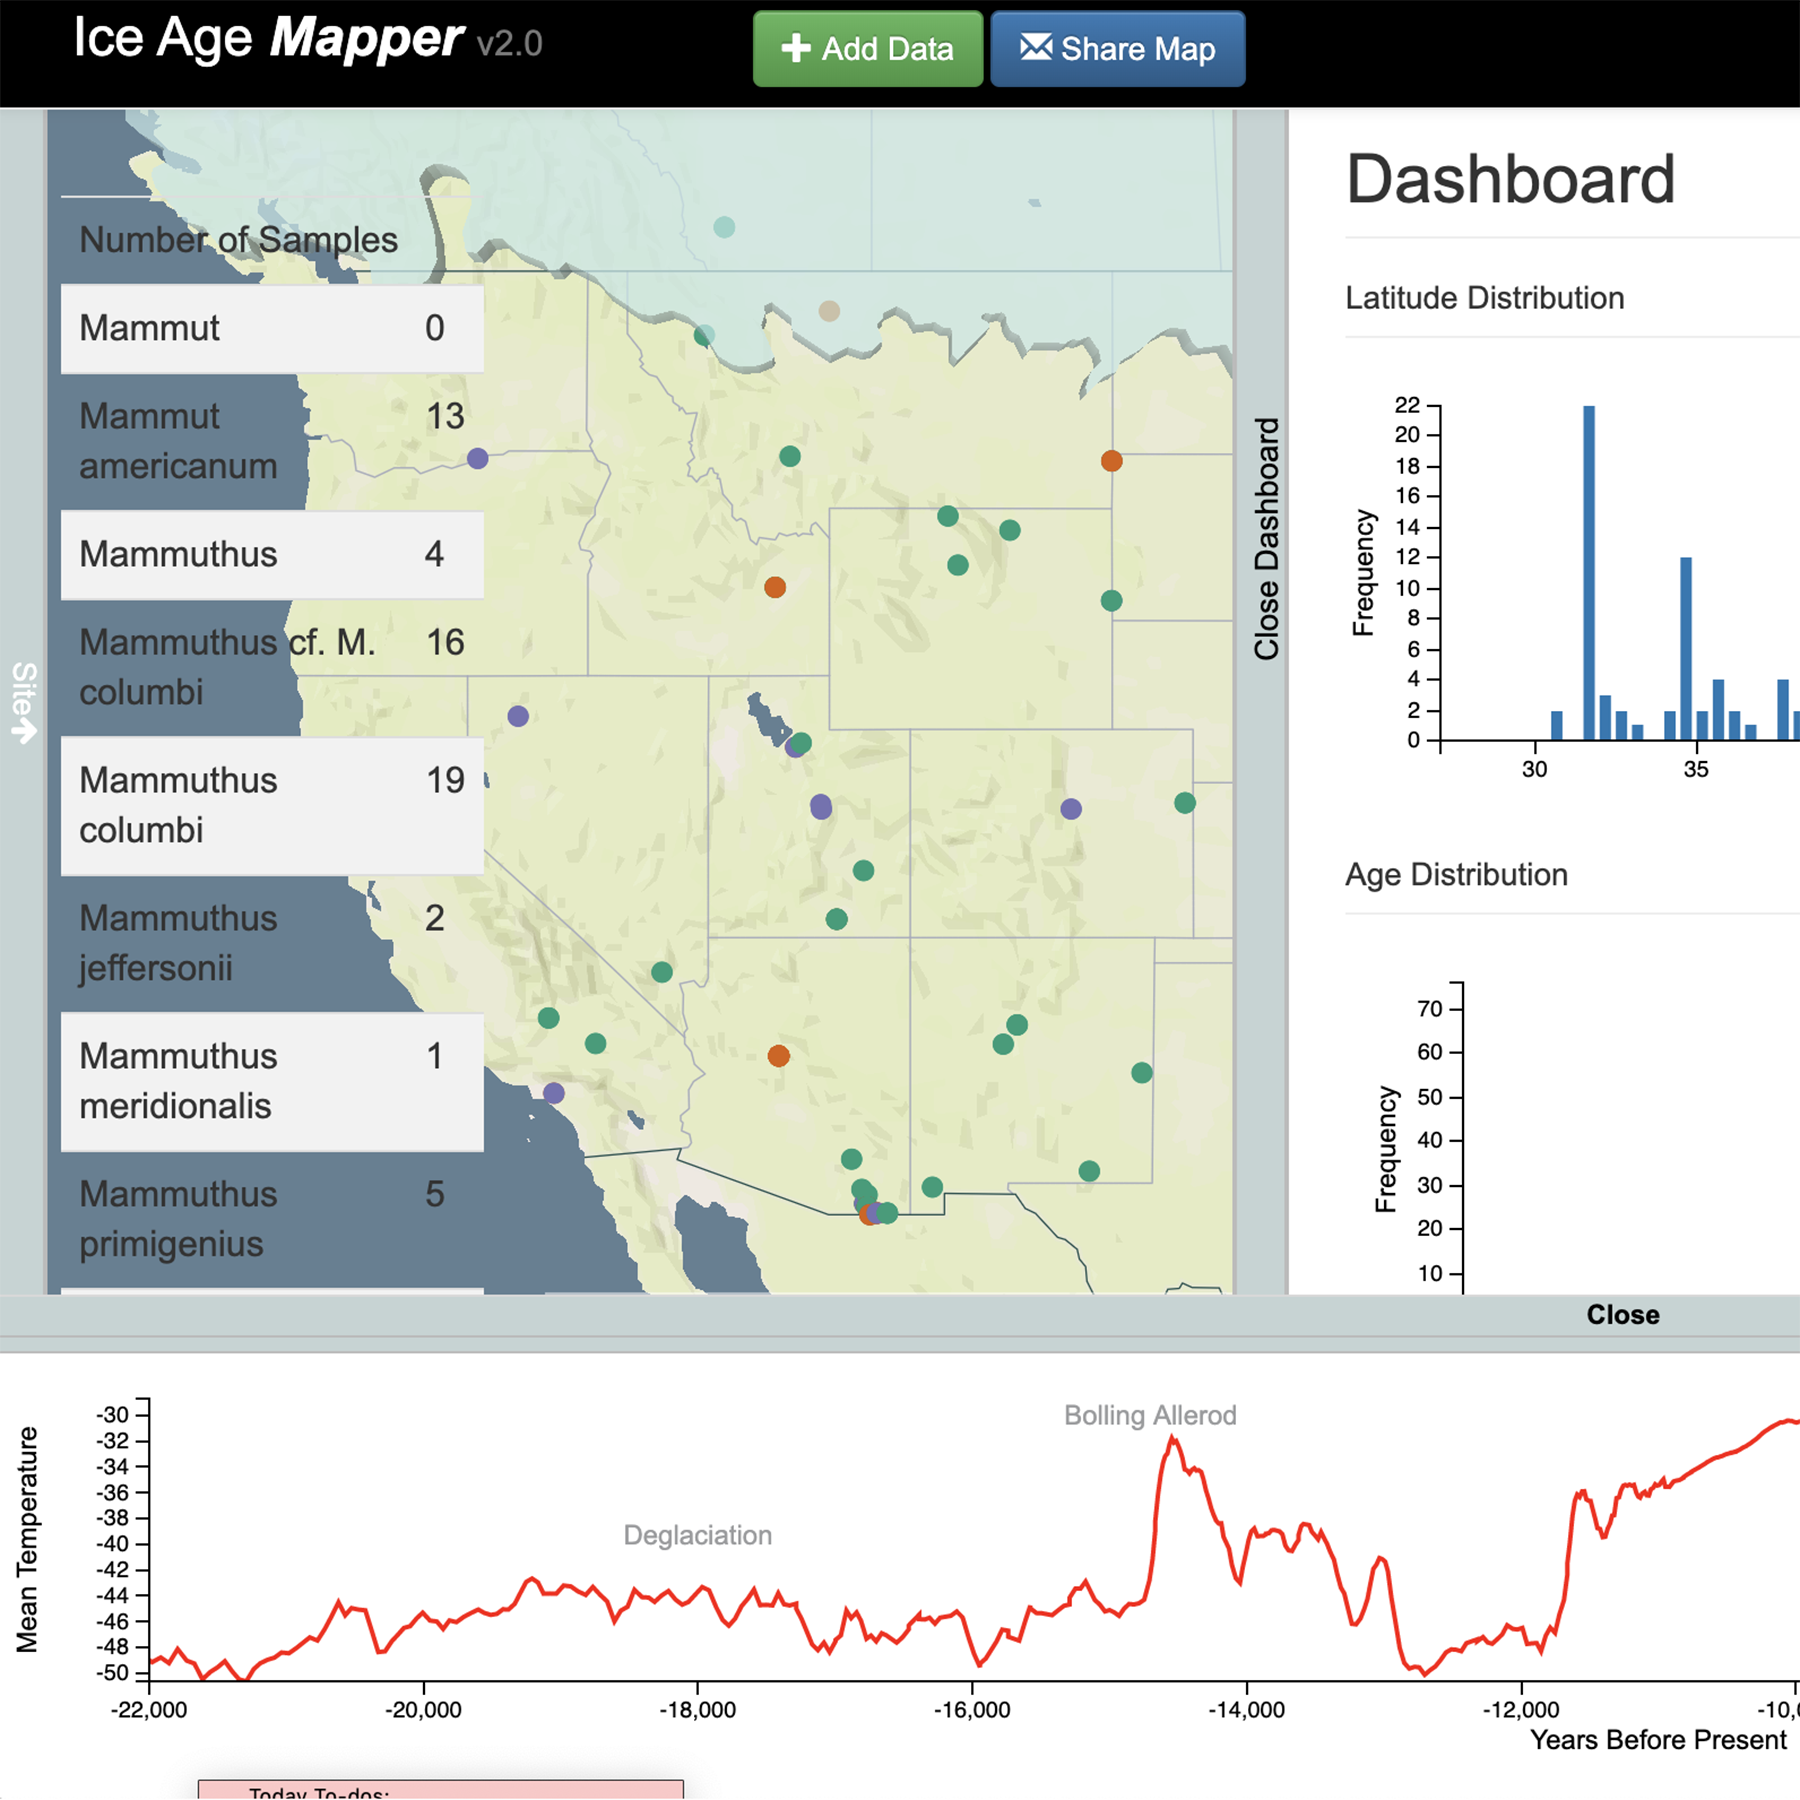
Ice Age Mapper
An online interactive map built by Scott Farley and updated by me using D3 to visualize the most up-to-date paleoecology data pulled from the Neotoma Paleoecology Database. You can look at individual site data and filter the sites by time, latitude, abundance, and investigator.